
Most people assume that aging is something that happens to you. That after 50, the trajectory is set, slower, softer, a little less capable each year. You accept it and manage it.
Our members didn't accept it. And we have the data to show what's possible when you don't.
We pulled every assessment on file from one of our studios. 171 members, average age 57, ranging from 40 to 92, and measured them against national health benchmarks across every metric we track: VO₂ max, strength, body composition, blood pressure, and resting heart rate.
What we found was remarkable. It is a direct challenge to what most people believe about aging and fitness.
What Is Biological Age, And Why Does It Matter?
Your chronological age is the number on your birthday cake. Your biological age is how old your body actually is. This age is measured by cardiovascular fitness, muscle function, metabolic health, and other markers that determine how well your body performs and how long it's likely to keep doing so.
The two numbers don't have to match. And at Smart Fit Method, they consistently don't.
This Is What Aging Backwards Looks Like
1. Cardiorespiratory Fitness - A Decade Younger
VO₂ max, your body's ability to use oxygen during exercise — is the single strongest predictor of longevity. A landmark study of over 122,000 patients found it predicts all-cause mortality more powerfully than blood pressure, cholesterol, or smoking status. Every incremental improvement matters: each preserved MET reduces mortality risk by roughly 13%.
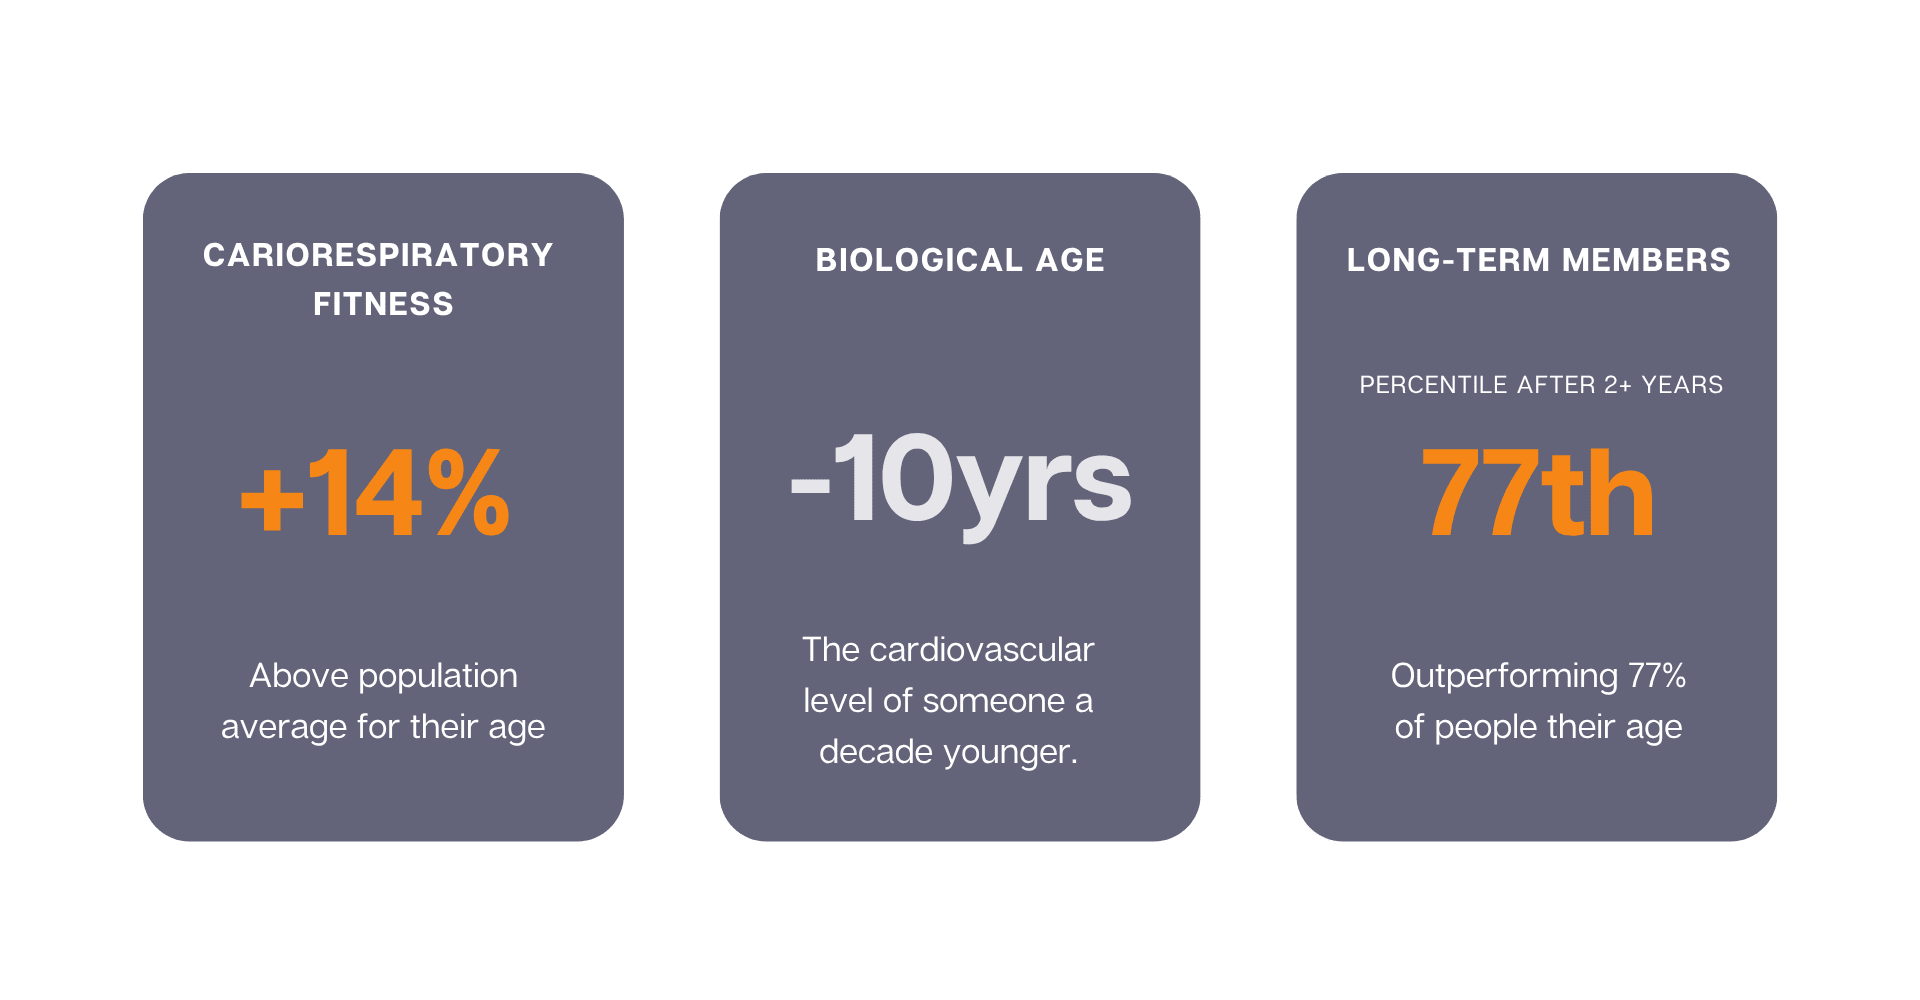
Our members average a VO₂ max of 33.2 ml/kg/min. The population average for a sedentary 57-year-old is roughly 28–30. In practical terms,that's the cardiovascular fitness of someone 10 to 15 years younger.
But the more compelling finding is what happens over time.
New members start near the population average, essentially where you'd expect them to be. After two or more years of training with us, they're at the 77th, meaning, they are outperforming 77% of people their age on the metric most directly linked to how long and how well they'll live.
No plateau or diminishing returns. What we're seeing is compounding improvement, year over year.
2. Strength: Going the Wrong Direction, On Purpose
After 50, the body loses 1–2% of muscle mass every year without intervention. Strength declines 1.5–3% annually.
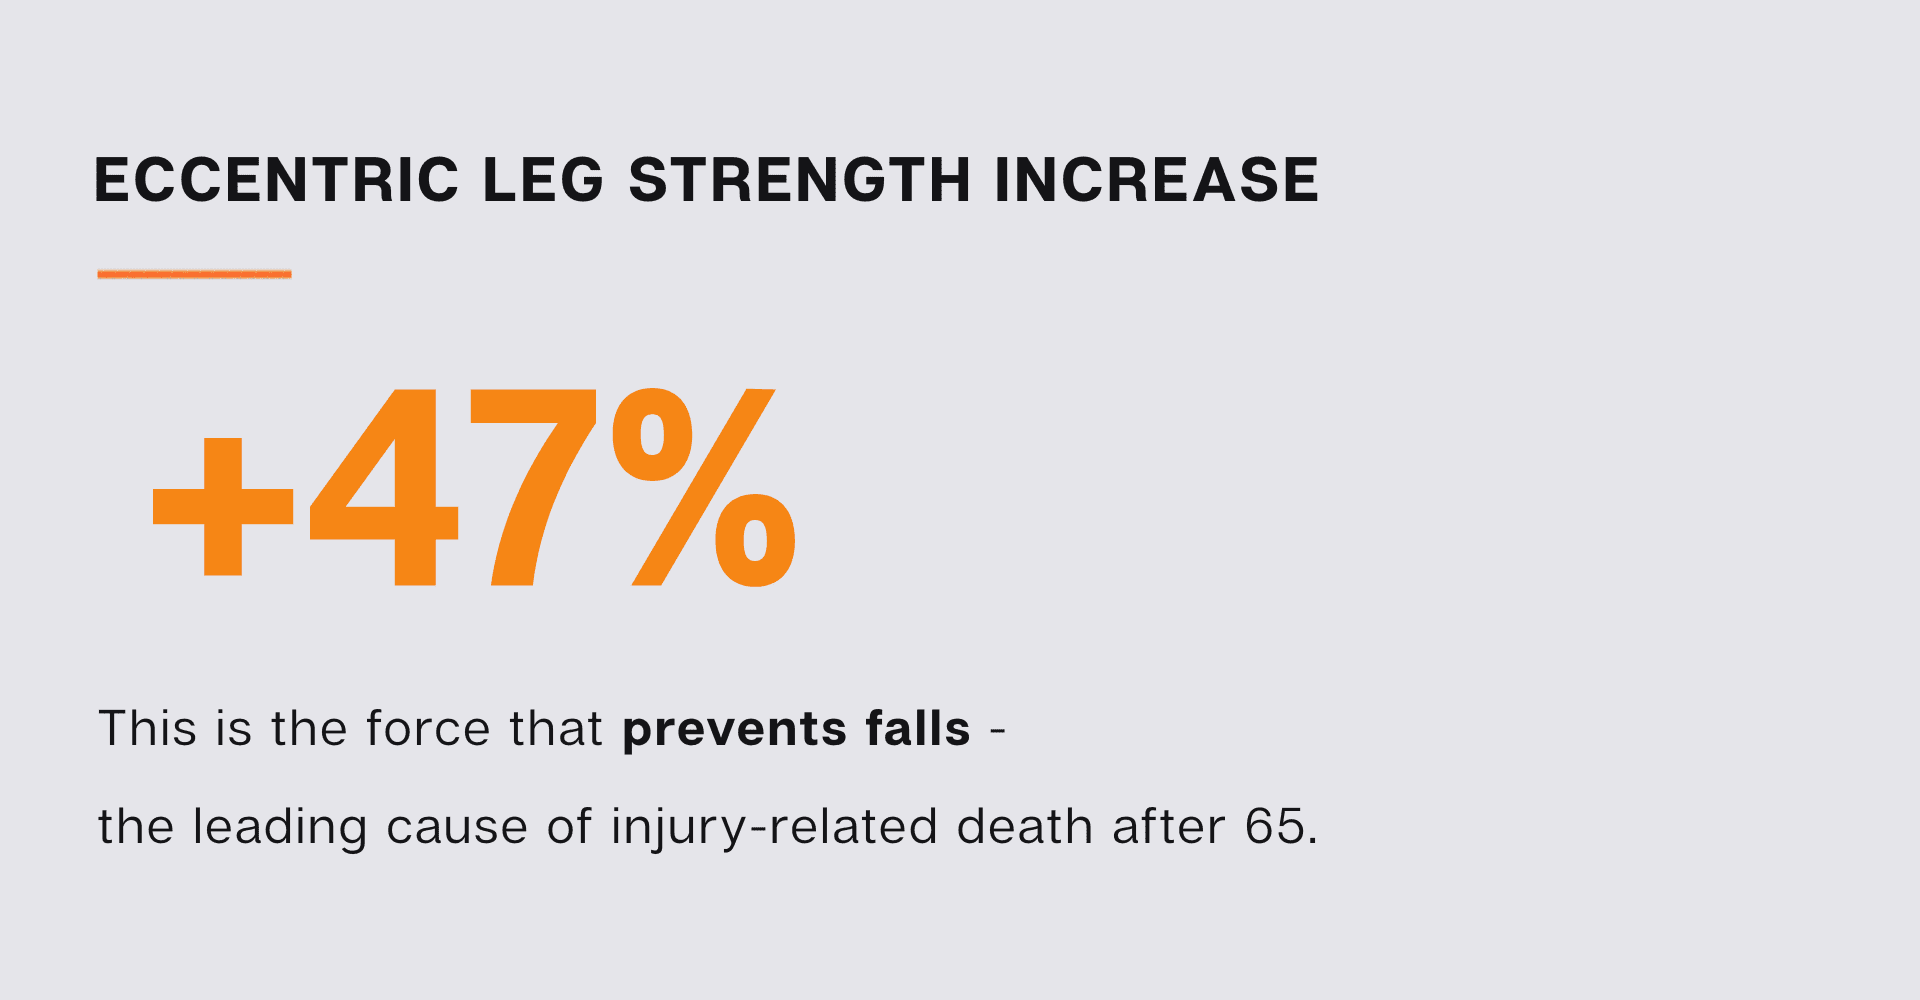
By 80, a sedentary person may have lost half their muscle. With that loss comes reduced balance, slower recovery, and a sharply elevated risk of falls, which is the number one cause of injury-related death in adults over 65.
Our members went the other direction.
Average leg press output increased 32%. Eccentric leg strength, the specific force that catches you before a fall, increased 47%.
Among those who improved, the average gain was 80%. Overall strength score increased 15%.
78% of re-tested members got measurably stronger across every movement pattern.
This isn't slowing the decline, or even maintaining strength. The data shows our members are gaining strength most people their age stopped believing was possible.
3. Body Composition: Leaner Than the National Average
Smart Fit men average 27% body fat, compared to a national average of 31% for their age group.
Women average 34%, compared to a national average of 42%.
That's a 4-point gap for men and an 8-point gap for women.
Among re-tested members, 65% reduced their body fat percentage, with an average reduction of 5.2%. Their weight stayed nearly flat throughout. This means body composition, fat replaced by lean muscle, without caloric restrictions or unhealthy diets.
4. Cardiovascular Health: Their Hearts Are Running Younger
The population average blood pressure for this age group is approximately 130/80. Our members average 116/75, that's 14 points lower on the systolic number that matters most.
For context: every 20 mmHg rise in systolic blood pressure doubles cardiovascular death risk. Our members are 14 points on the right side of that equation.
Resting heart rate tells the same story.
79% of assessed members are below 70 bpm.
37% are below 60 — the threshold considered the athlete range.
Research consistently shows that each 10 bpm increase in resting heart rate is associated with a 15% increase in all-cause mortality.
5. Women's Wellness: Built Differently, By Design
Most fitness research has historically been conducted on men. Most programs follow suit, and are designed for male physiology and loosely adapted for women.
Smart Fit Method programs specifically to and for women's physiology, from pregnancy to perimenopause through postmenopause and beyond. Hormonal shifts, bone density, muscle recruitment patterns, all of it is accounted for in how the program is built and adjusted over time.
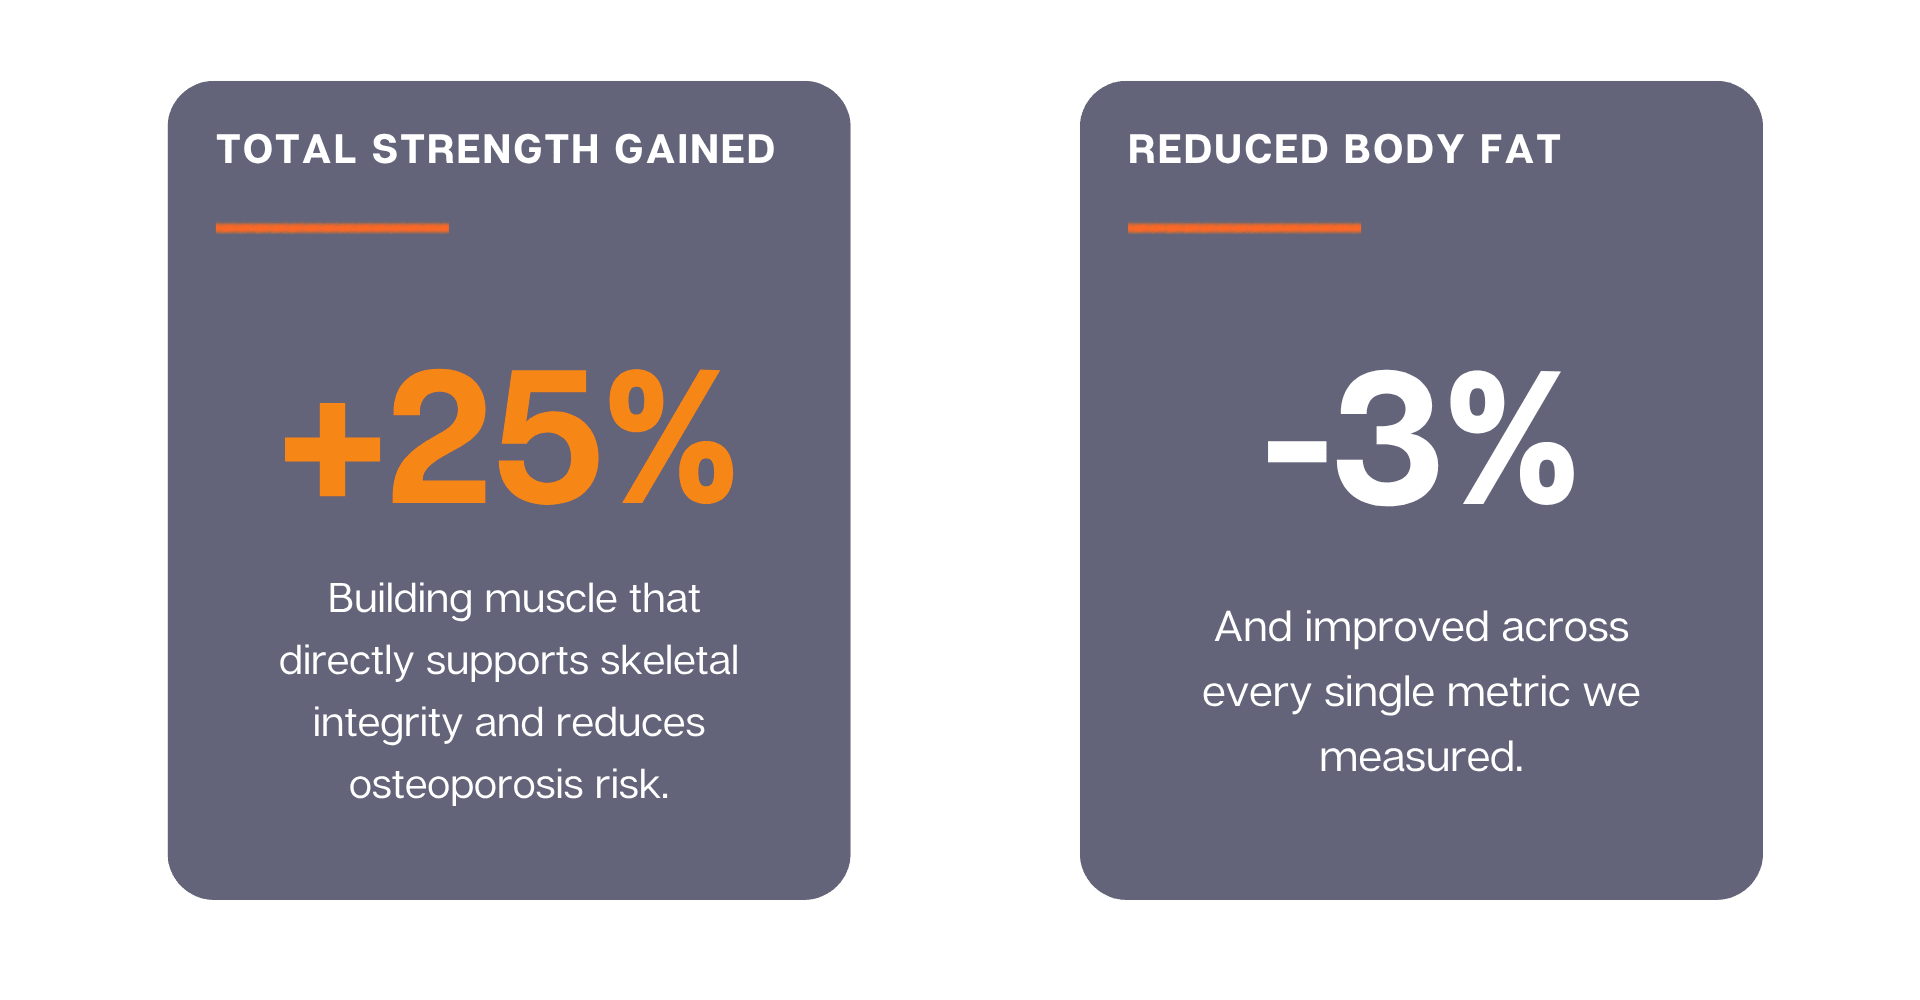
Resistance training is one of the most evidence-backed ways to counter that loss by building muscle that directly supports skeletal integrity and reduces osteoporosis risk.
Our female members gained 25% in total strength, reduced body fat by 3%, and improved across every single metric we measured.
The Bigger Picture
At an average age of 57, these members have the cardiovascular profile, the body composition, and the functional strength of people 10 to 15 years younger.
They didn't get there by working harder. They got there because every session was tracked, measured, and calibrated to their unique baseline, biology, and goals. The programming adapted as they did. And the community around them, people with the same commitment to living well, made showing up effortless.
You can be stronger and have the cardiovascular fitness of someone a decade younger, and continue improving, year after year.
The only thing standing between you and that outcome is a program built specifically for you, and the right experts in your corner.
Book Your Complimentary Session→
Data from 171 members assessed between September 2024 and April 2026. Population benchmarks sourced from NHANES, ACSM, AHA, and JAMA Network Open (2018). Full methodology available upon request.